Peter de Jong Attractors
Last week I published a new web toy, a Peter de Jong attractor visualiser.
I've pretty much always been a Massive Nerd ™, so it's no surprise that in the mid 2000's I was a big fan of the TV show NUMB3RS. This sparked a real interest in popular science and recreational mathematics within me, and I soon found a copy of Clifford A. Pickover's A Passion for Mathematics in my local Borders bookshop.
Inspired by the Ikeda and Lorenz attractors featured in Pickover's book, I went on a wee web search and stumbled upon Paul Bourke's site and his page on Peter de Jong attractors.
According to an article in Scientific American, linked from Paul's site,
A reader in Holland, Peter de Jong of Leiden, has already suggested some other iteration formulas that produce bizarre shapes and images.
The formulas he suggested are

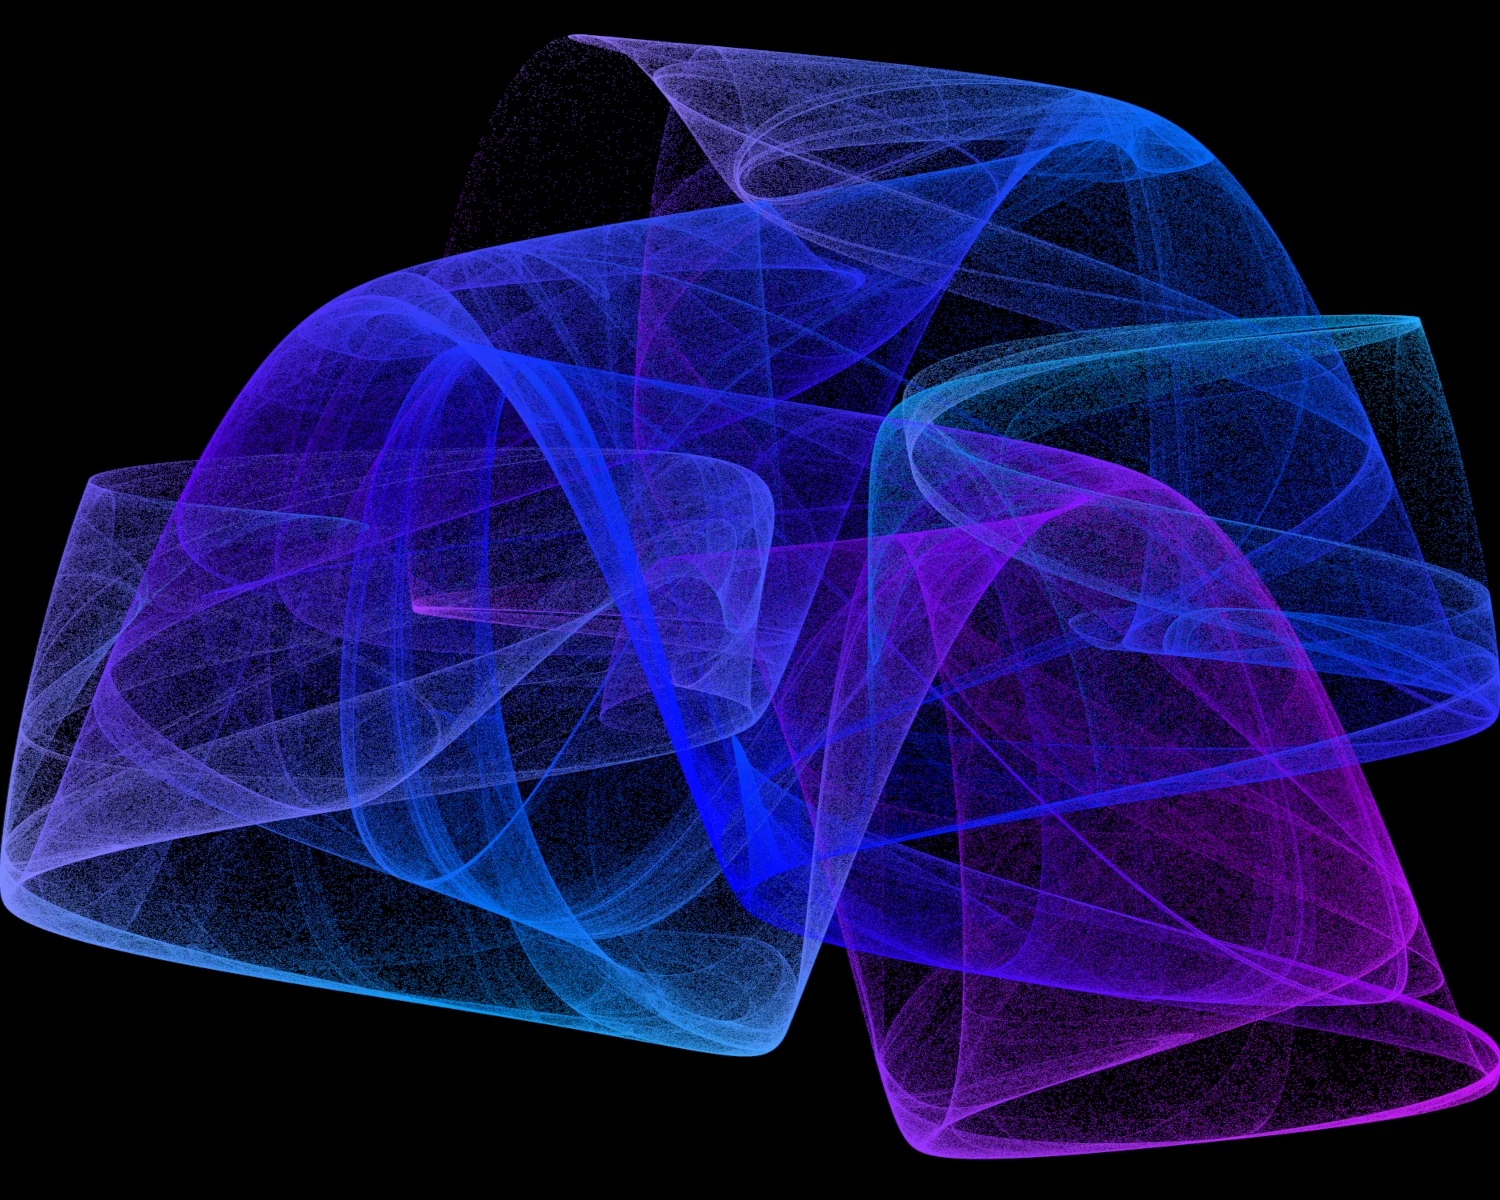
and those co-efficients, a, b, c, and d, are where the magic lies. Many, many, combinations of a, b, c, and d produce absolutely nothing remarkable, but on occasion something interesting happens. I've included quite a few nice examples within my web toy, including those first reported by Peter de Jong, several from Paul Bourke's work, and a few I've found on my own.
Over the years, I've returned to this attractor again and again, writing versions in C for Win32, C# for WinForms, and even a version in Perl which rendered its visualisation to a P3 format PPM Netpbm file. It's a nice, simple, kata that I wheel out whenever I get the itch to generate some pretty pictures. This latest version is written in plain JavaScript, rendering the output to a canvas element. It comes with a small amount of interactivity to allow the user to change the co-efficients, a, b, c, and d, and see how the visualisation changes.
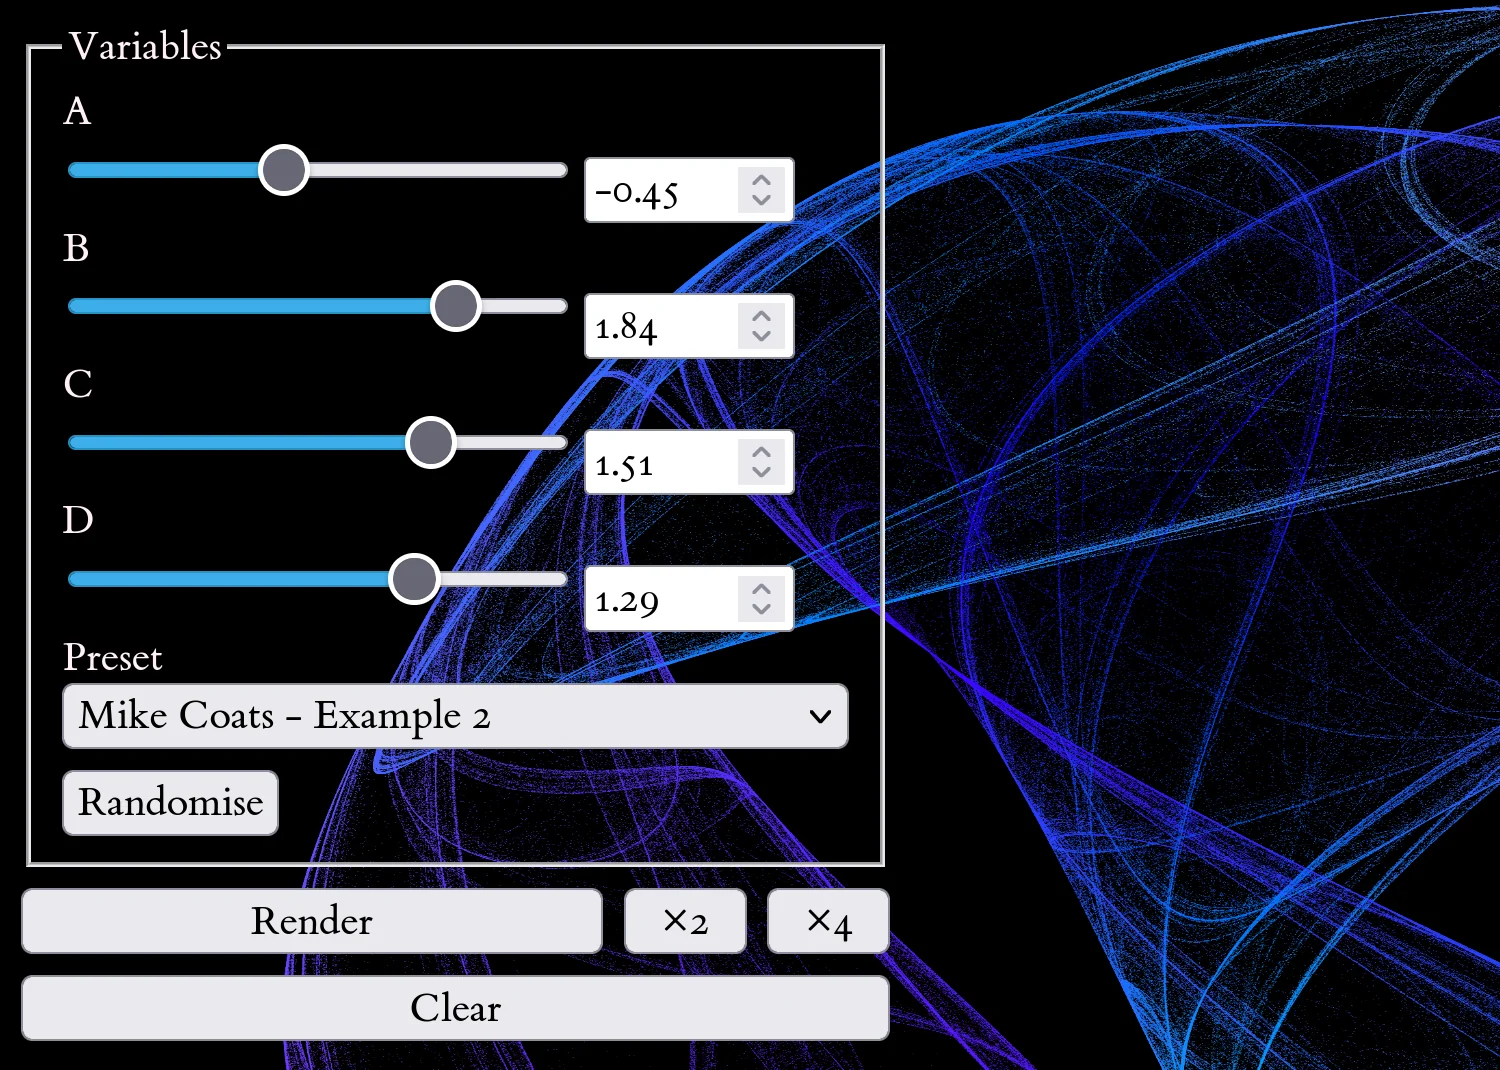
To try the web toy, choose your own values for the A, B, C, and D parameters and press Render to explore the attractor's behaviour. Select a Preset to load a set of values and visualise a specific attractor. Press the Randomise button to generate new values for the A, B, C, and D parameters.
The rendering code runs in the browser, so speed is based on your device's capabilities. The "fullness" of the visualisation is determined by the number of iterations. The default number of iterations is limited to 500,000 to prevent excessive computation. Repeatedly pressing the "Render" button will increase the number of iterations, further "developing" the visualisation. On more powerful devices you can increase the number of iterations by pressing the "x2" or "x4" buttons.
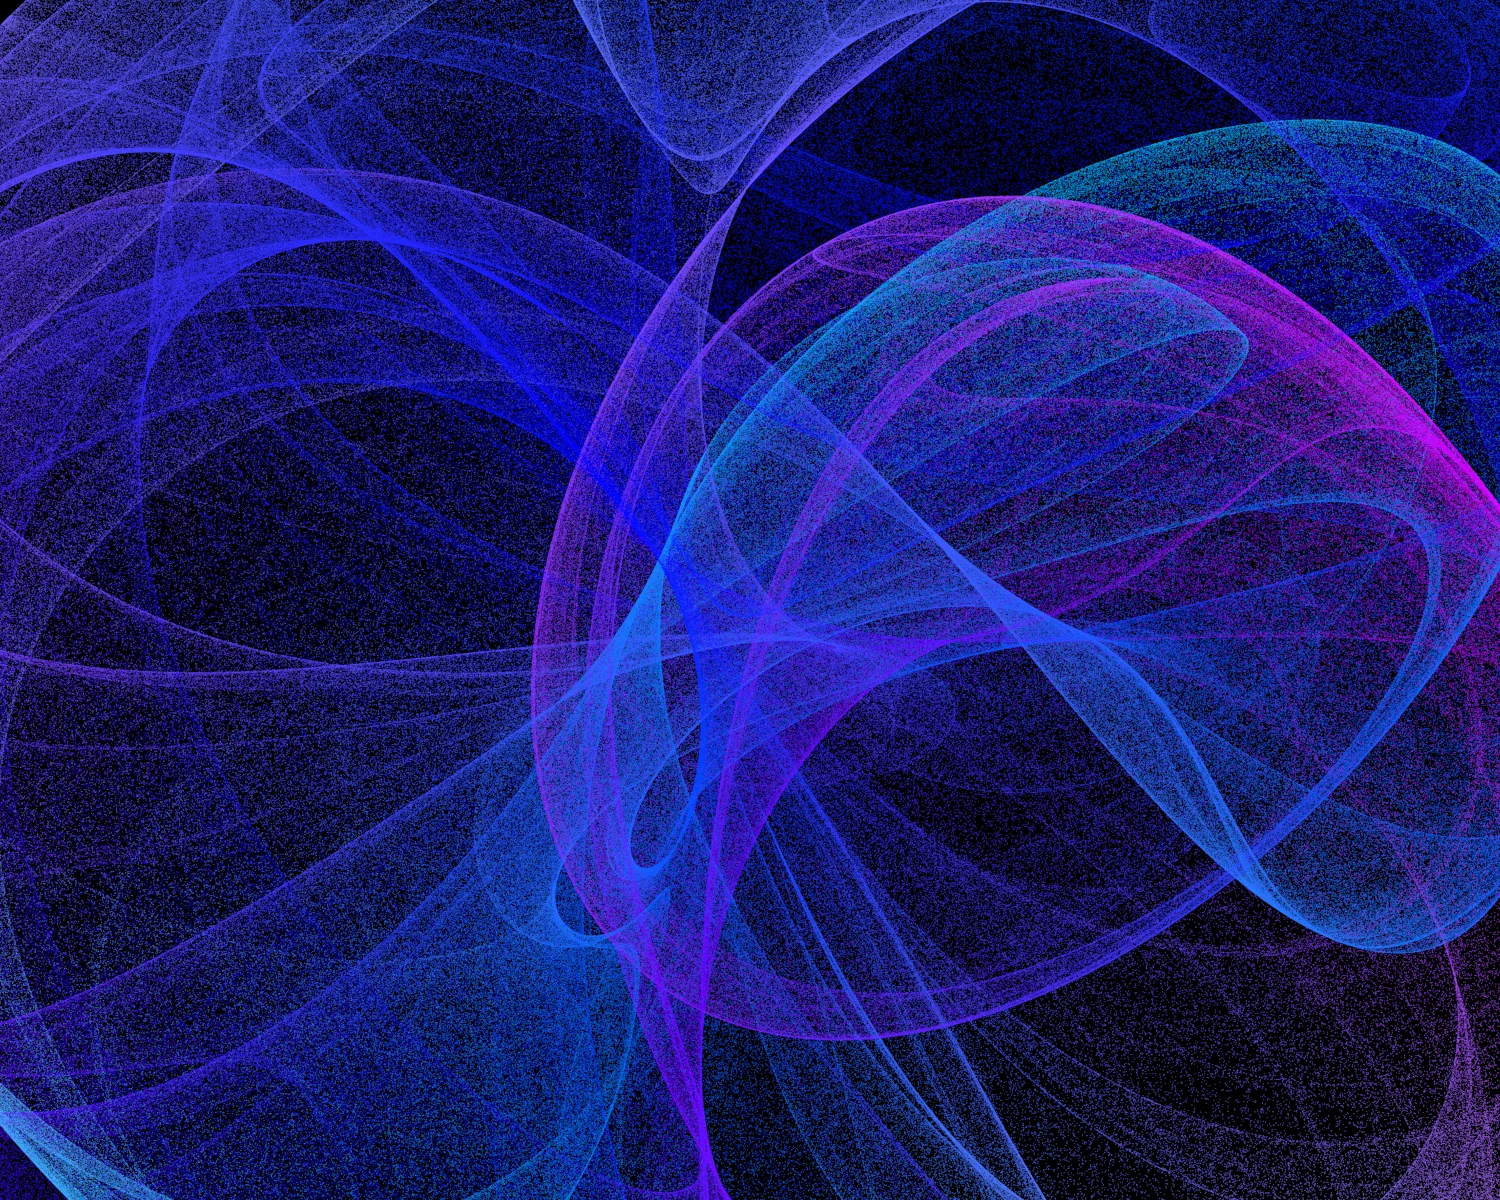
If you produce a particularly pleasing picture, Firefox and Chromium-based browsers will allow you to save the image from the right-click menu. According to the MDN documentation, 4096 is the maximum canvas size for certain devices, so that's the native size of the canvas we render to. This lets us either scale the visualisation to fit our needs or even zoom right in on the fine detail within the rendered output.
I hope you can have some fun with your spare CPU cycles and produce some interesting visuals. All the code is available from my Codeberg repository. It's free software, so you can redistribute it and/or modify it under the terms of the GNU General Public License as published by the Free Software Foundation, either version 3 of the License, or (at your option) any later version.
Please feel free to edit, change, and rebuild it as you see fit. This toy only has one rendering algorithm built in to it at the moment. I'd like to expand the code to explore different ways of colouring the visualisations, potentially highlighting any interesting artefacts of the generation process.
2026-06-11